Collecting Data Remotely to Optimize Clinical Simulations
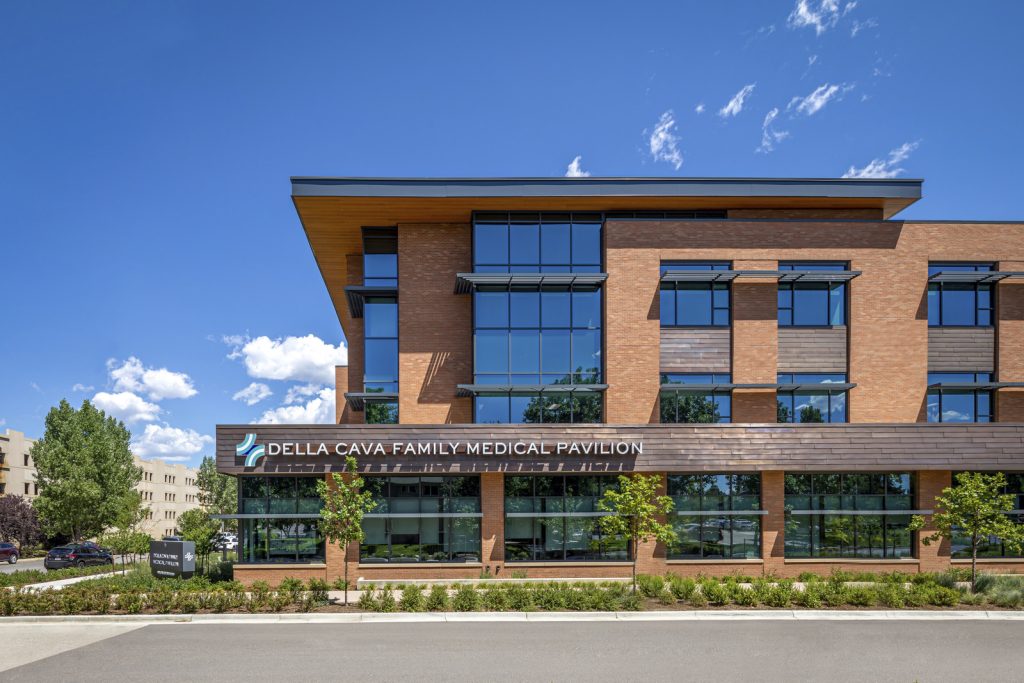
Bakersfield, California
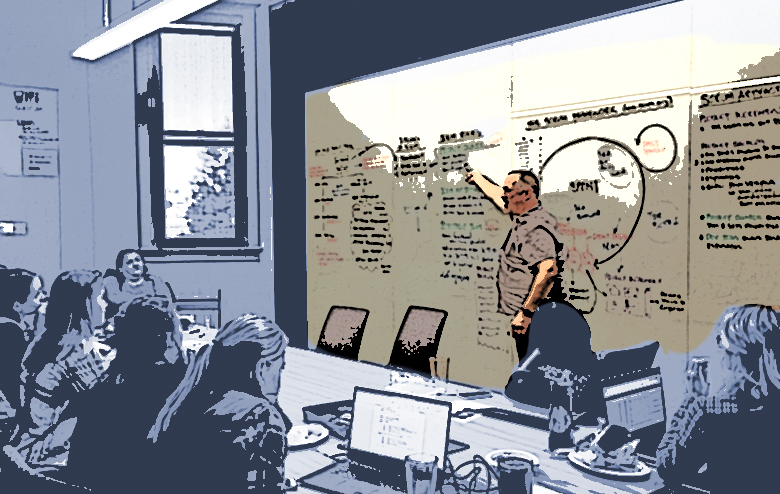
Boulder Associates is designing 50,000–square–foot community health center for a Federally Qualified Health Center provider in northern California. In the fall of 2019, as part of the design process, BA/Science participated in a week-long 3P event that helped CSV brainstorm for the ideals and goals for the project related to patient care, staff experience, and flow/layout options. The event, involving leadership, frontline staff, and patients, created great excitement within the organization and gave the project momentum to push forward.
However, as the project moved into design development in the 2nd quarter of 2020, the design team felt that the project had lost its initial focus and the muddied priorities made making design decisions a challenge. Normally we would propose some onsite workshops to resolve this, but then COVID happened!
The team was already considering using Flexsim to run simulations of the day-to-day operations of the clinic as a means of validating their design. Considering the challenges facing the project, they decided to apply the expertise of the BA/Science team and use Flexsim to help the client make the decisions needed to move the project forward.
Gathering the data remotely
Any simulation requires some basic information: How often does something happen? What is hourly/daily patient volume? What typical processes does a patient go through? What resources are involved?
We identified the outputs the team wanted from the model and identified the information needed to create the simulations. Typically, this data was collected onsite, either by working with facility staff, or direct observation and recording of clinic operations and workflows. In the COVID-era, onsite data collection by BA/Science staff was out of the question, so we had to develop tools and approaches to gather the information remotely.
We developed several cloud-based data collection spreadsheets that the client was able to work in. One collected information of resources and scheduling and the other spreadsheet collected information on typical patient flows and cycle time.
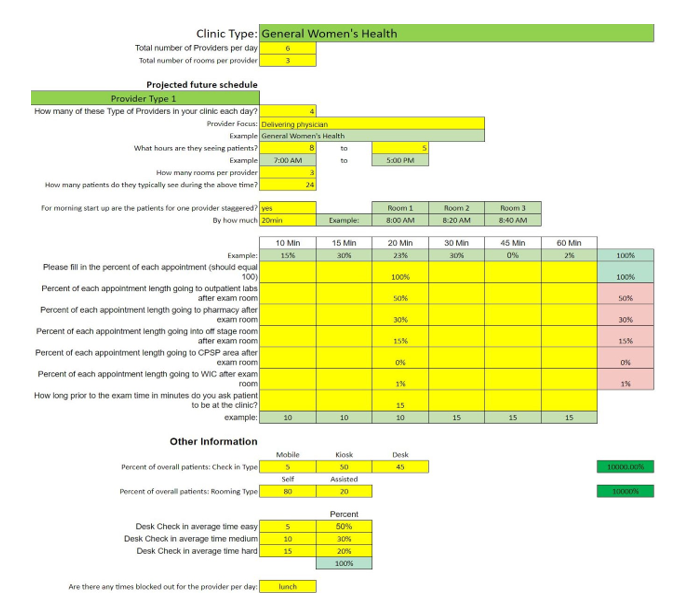
Working sessions were held with the client to train them on how to use the spreadsheets and what data to collect. Over the course of three weeks, we were able to monitor the progress of the data collection from the shared spreadsheet and keep the client on track.
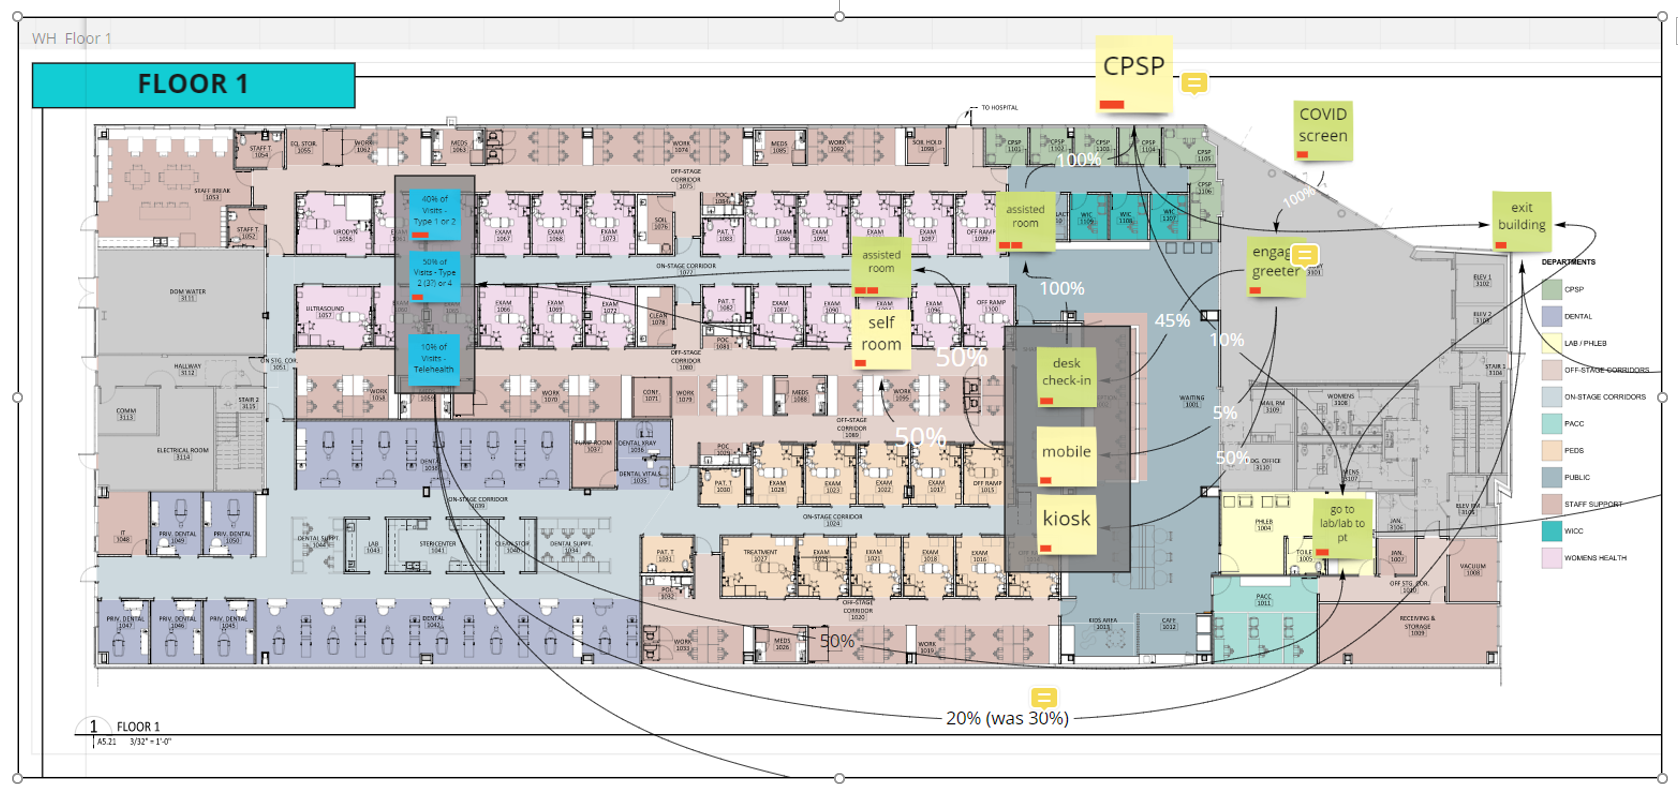
To understand how patients flowed through the clinic during their visit, we held virtual workshops with staff from each clinical area. What percent used a kiosk? What percent went to the lab after a visit? etc. The patient journey was mapped and laid over the concept layout in Miro, another online visualization and coordination tool. This exercise allowed the team to set data points on where patients had multiple choices presented to them.
How we used the data to inform the design
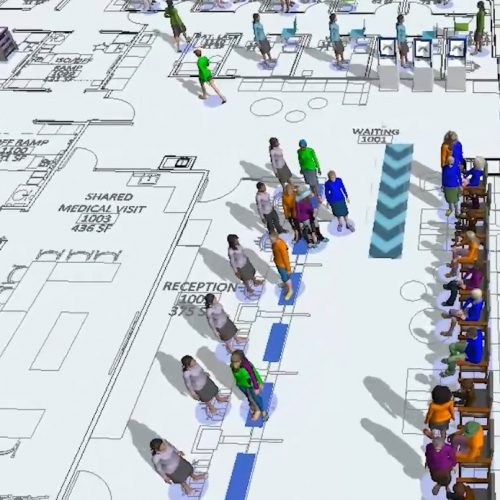
With the volume and process flow data in hand, we were able to develop the Flexsim model. The goal was for Flexsim was provide data on the utilization of each resource (COVID screeners, greeters, kiosks, exam rooms, waiting rooms, lab and pharmacy etc.) within the clinic under different scenarios and loads.
As the model became functional it began to uncover some items for the client to consider. What time does the building open? Where will the greeters be stationed? When will patients be allowed to register? How much before an appointment time will they be allowed to room? It also was clear that key areas needed more resources, like COVID screening and greeter positions.
As the model became functional it began to uncover some items for the client to consider. What time does the building open? Where will the greeters be stationed? When will patients be allowed to register? How much before an appointment time will they be allowed to room? It also was clear that key areas needed more resources, like COVID screening and greeter positions.
As the model was refined to more closely representing the true future state, it started to provide key data on patient wait times for lab, pharmacy, and registration. Based on the data from the model, the team decided to eliminate the pharmacy and move the lab to the first floor where there was more waiting room space.
In addition to the above, the Flexsim model was relied upon to inform other design and operational decisions. It was used to determine the number and size of registration areas, number of patients/visitors allowed per floor, etc. It helped the client make the necessary decisions, and it was very cool to see the design team update the design throughout the process based on this data-driven decision-making. In addition, we provided the client an executive summary with data analysis and recommendations for the client to consider, including post-occupancy operational improvements.
What we found through this process is that when we can fully integrate design with data, technology, and operational optimization, the team, as a whole (designers/clients), can be confident about their design decisions. It helped redirect efforts of users and realign their goals as a group and prompted larger conversations beyond the individual project and helped to focus the team’s intentions. This results in quicker decision-making, reduces the likelihood of re-visiting made decisions, and fundamentally results in a better design.
